Stories - The Training Data
A training data sample for the dialogue system is called a story. This shows you how to define them and how to visualise them.
Format
Here’s an example from the bAbi data:
## story_07715946                     <!-- name of the story - just for debugging -->
* greet
   - action_ask_howcanhelp
* inform{"location": "rome", "price": "cheap"}  <!-- user utterance, in format intent{entities} -->
   - action_on_it
   - action_ask_cuisine
* inform{"cuisine": "spanish"}
   - action_ask_numpeople             <!-- action of the bot to execute -->
* inform{"people": "six"}
   - action_ack_dosearch
This is what we call a story. A story starts with a name preceded by two
hashes ## story_03248462, this is arbitrary but can be used for debugging.
The end of a story is denoted by a newline, and then a new story starts again with ##.
You can use > checkpoints to modularize and simplify your training data:
## first story
* hello
   - action_ask_user_question
> check_asked_question

## user affirms question
> check_asked_question
* affirm
  - action_handle_affirmation

## user denies question
> check_asked_question
* deny
  - action_handle_denial
Note
You can also spread your stories across multiple files and specify the folder containing the files for most of the scripts (e.g. training, visualization). The stories will be treated as if they would have been part of one large file.
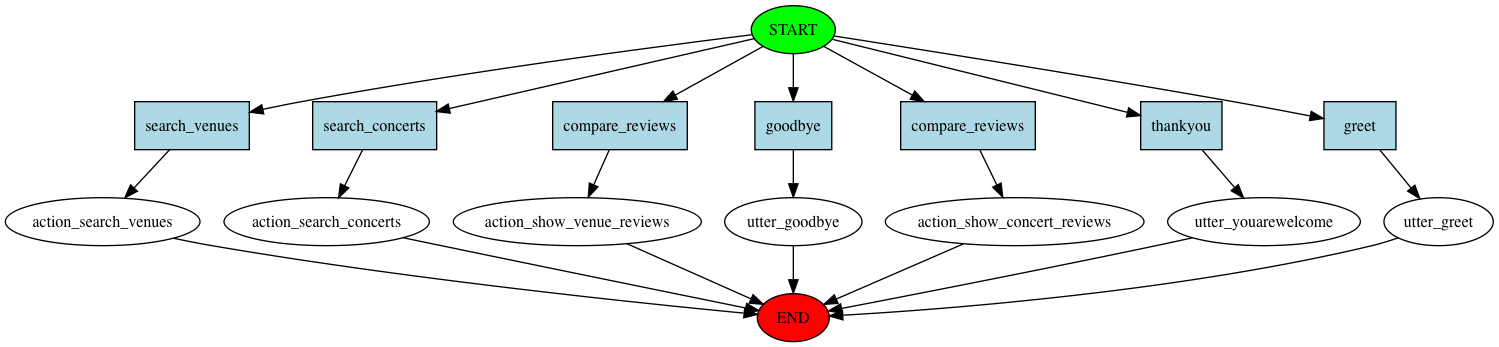
Visualization of Stories
Sometimes it is helpful to get an overview of the conversational paths that are described within a story file. To make debugging easier and to ease discussions about bot flows, you can visualize the content of a story file.
Note
For this to work, you need to install graphviz. These are the instructions to do that on OSX, for other systems the instructions might be slightly different:
brew install graphviz
pip install pygraphviz --install-option="--include-path=/usr/include/graphviz" \
  --install-option="--library-path=/usr/lib/graphviz/"
As soon as this is installed you can visualize stories like this:
cd examples/concertbot/
python -m rasa_core.visualize -d concert_domain.yml -s data/stories.md -o graph.png
This will run through the stories of the concertbot example in
data/stories.md and create a graph stored in the
output image graph.png.
We can also run the visualisation directly from code. For this example, we can
create a visualize.py in examples/concertbot with the following code:
from __future__ import absolute_import
from __future__ import division
from __future__ import print_function
from __future__ import unicode_literals

from rasa_core.agent import Agent
from rasa_core.policies.keras_policy import KerasPolicy
from rasa_core.policies.memoization import MemoizationPolicy

if __name__ == '__main__':
    agent = Agent("concert_domain.yml",
                  policies=[MemoizationPolicy(), KerasPolicy()])

    agent.visualize("data/stories.md",
                    output_file="graph.png", max_history=2)
Which will create the same image as the above python script call. The shown graph is still very simple, but the graphs can get quite complex.
If you want to replace the messages from the stories file, which usually look
like greet with real messages e.g. Hello, you can pass in a Rasa
NLU training data instance to replace them with messages from your training
data.
Note
The story visualization needs to load your domain. If you have
any custom actions written in python make sure they are part of the python
path, and can be loaded by the visualization script using the module path
given for the action in the domain (e.g. actions.ActionSearchVenues).