Training Data Format
Here’s an example from the bAbi data:
## story_07715946
* _greet
   - action_ask_howcanhelp
* _inform[location=rome,price=cheap]
   - action_on_it
   - action_ask_cuisine
* _inform[cuisine=spanish]
   - action_ask_numpeople
* _inform[people=six]
   - action_ack_dosearch
This is what we call a story. A story starts with a name preceeded by two
hashes ## story_03248462, this is arbitrary but can be used for debugging.
After this point, we have two types of events which sequentially happen when separated by a newline.
An event such as * _inform[location=bombay] is a user utterance. These utterances are written like * _{intent}[{entities}].
The intent and entities provided (as well as those in the past)
are the input features to the neural network which then predicts the bot’s next action,
which is in the format - action_{action_name} where actions can be anything from a bot response sent
to the user or something internal. For example in our case,
- action_store_stot stores the entities given by the user into internal slots within the bot. The user will not
see this step. However, something such as - action_ask_howcanhelp is the bot asking how it can help.
The end of a story is denoted by a newline, and then a new story starts again with ##.
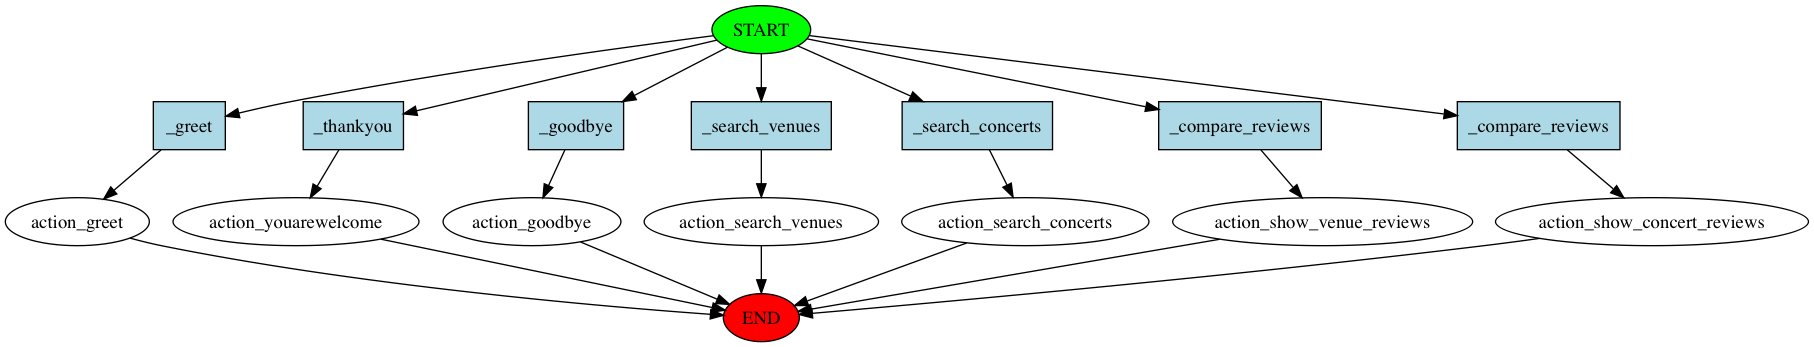
Visualization of story training data
Sometimes it is helpful to get an overview of the conversational paths that are described within a story file. To make debugging easier and to ease discussions about bot flows, you can visualize the content of a story file. For this to work, you need to install graphviz. These are the instructions to do that on OSX, for other systems the instructions might be slightly different:
brew install graphviz
pip install pygraphviz --install-option="--include-path=/usr/include/graphviz" --install-option="--library-path=/usr/lib/graphviz/"
As soon as this is installed you can visualize stories like this:
python -m rasa_core.visualize -d examples/concerts/data/stories.md -o graph.png
This will run through the stories in examples/concerts/data/stories.md and create a graph stored in the
output image graph.png.
You can also call the visualization directly from your code using:
from rasa_core.training_utils import create_stories_from_file
from rasa_core.training_utils.visualization import visualize_stories
from rasa_nlu.converters import load_data

stories = create_stories_from_file("examples/babi/data/babi_task5_dev_rasa_even_smaller.md")
training_data = load_data("examples/babi/data/babi_dialog_nlu.json")
visualize_stories(stories, "graph.png", training_data=training_data)
Which will create the same image as the above python script call. The shown graph is still very simple, but the graphs can get quite complex.
If you want to replace the intent & entity messages in the box with real world messages
(if you want to replace the messages from the stories file, which
usually look like _greet with real messages e.g. hello), you can pass in a Rasa
NLU training data instance to replace them with messages from your training data, as we
did in the above example with the training_data variable.